
As today's applications become more complex and distributed, it is critical to have a robust monitoring and analytics system in place to track system performance, availability, and health. A scalable distributed system usually consists of several components that work together to achieve the desired performance. These components can run on different servers, data centers or even different continents.
A scalable distributed system has several distinct components, and any failure in one component can cause a cascading effect on other components. Therefore, it is necessary to have a monitoring system to identify and alert the system administrators about any problems. System monitoring can also provide statistics about system performance and resource consumption. Analytics can help identify patterns, trends, and anomalies in system behavior, which can be used to improve overall system performance and scalability.
A scalable distributed system must be designed with the assumption that components may fail at any time. A monitoring system that continuously checks the health of the system can help identify and notify these failures quickly. As a result, downtime is minimized and the impact on end users is reduced.
The first step in implementing a monitoring system is to define the metrics to be tracked. Metrics should be related to system performance, availability, and resource utilization. Examples of metrics include response time, error rate, CPU usage, memory usage, network latency, and throughput. After defining the metrics, it is necessary to set the alert threshold for each metric. These thresholds should be based on system requirements and generate alerts when the system deviates from expected behavior.
Choosing the right monitoring tool is very important for the effectiveness of the monitoring system. There are many monitoring tools available in the market and each has its strengths and weaknesses. Some tools are better suited for infrastructure monitoring, while others are better suited for application-level monitoring. In System Monitor, you should choose a tool that can monitor all system components, including infrastructure, applications, and databases.
Distributed tracing is a technique that traces the flow of a request in a distributed system with separate parts. This type of tracing allows system administrators to understand how requests are processed by various system components. By using this method, it can identify the location of the error in a distributed system as well as the bottlenecks.
Logs provide valuable information about system behavior and can be used to identify issues and errors. Implementing a log collection and analysis system can help identify patterns, trends, and anomalies in system behavior. It can also help identify security issues and potential attacks.
Machine learning-based analysis can help identify hidden patterns, trends, and anomalies. Things that may not be revealed through human supervision. Machine learning algorithms can learn from past data and provide analysis about system behavior. These analyzes can be used to optimize system performance and scalability.
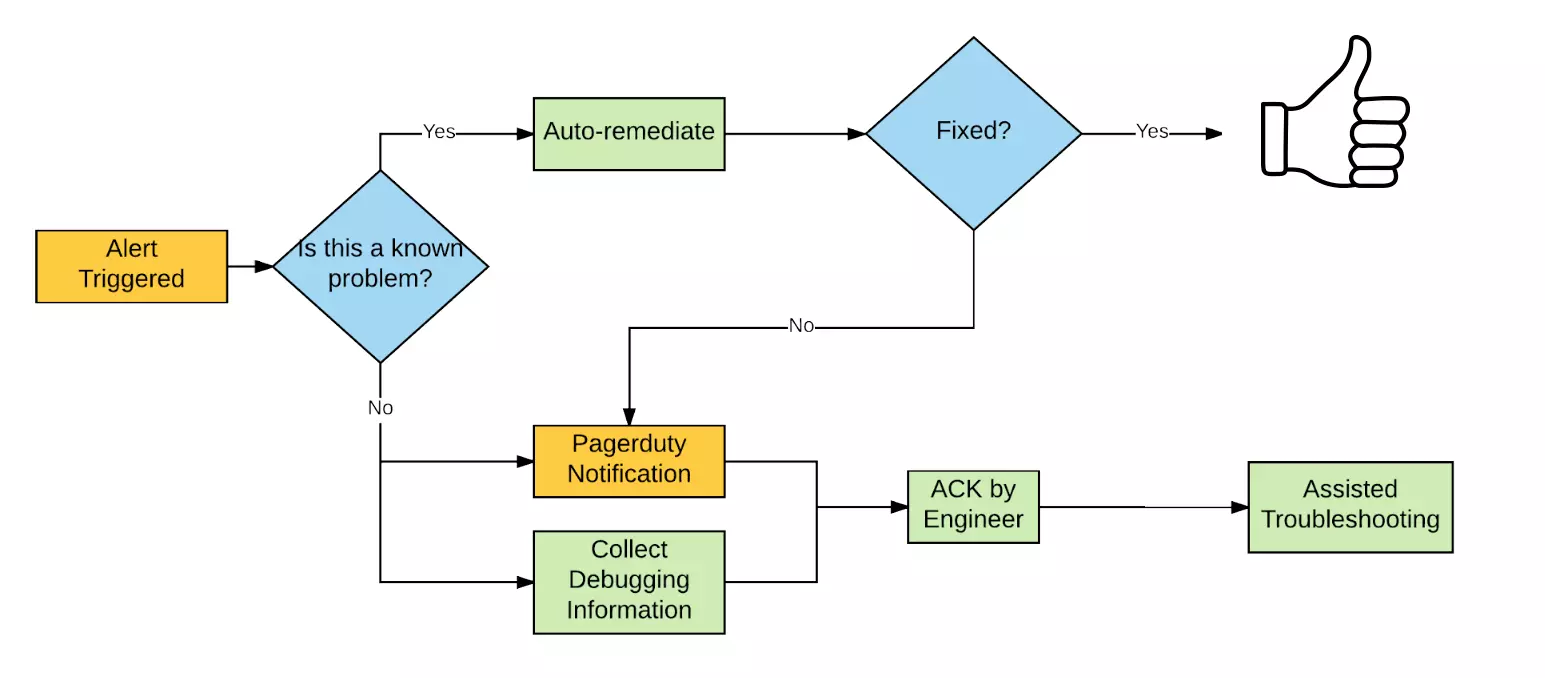
Automate Remediation is an essential part of a monitoring system. When an alert is triggered, the system should automatically take corrective action to fix the problem. These fixes can include restarting a failed component, increasing or decreasing resources, or routing traffic to healthy components.
There are several monitoring tools available for monitoring and analysis in a scalable distributed system that can be used. In the following, some popular tools are briefly introduced.
Prometheus: Prometheus is an open source monitoring system that collects metrics from various sources and stores them in a time-series database. This tool has a powerful query language that can be used to query metrics and generate alerts.
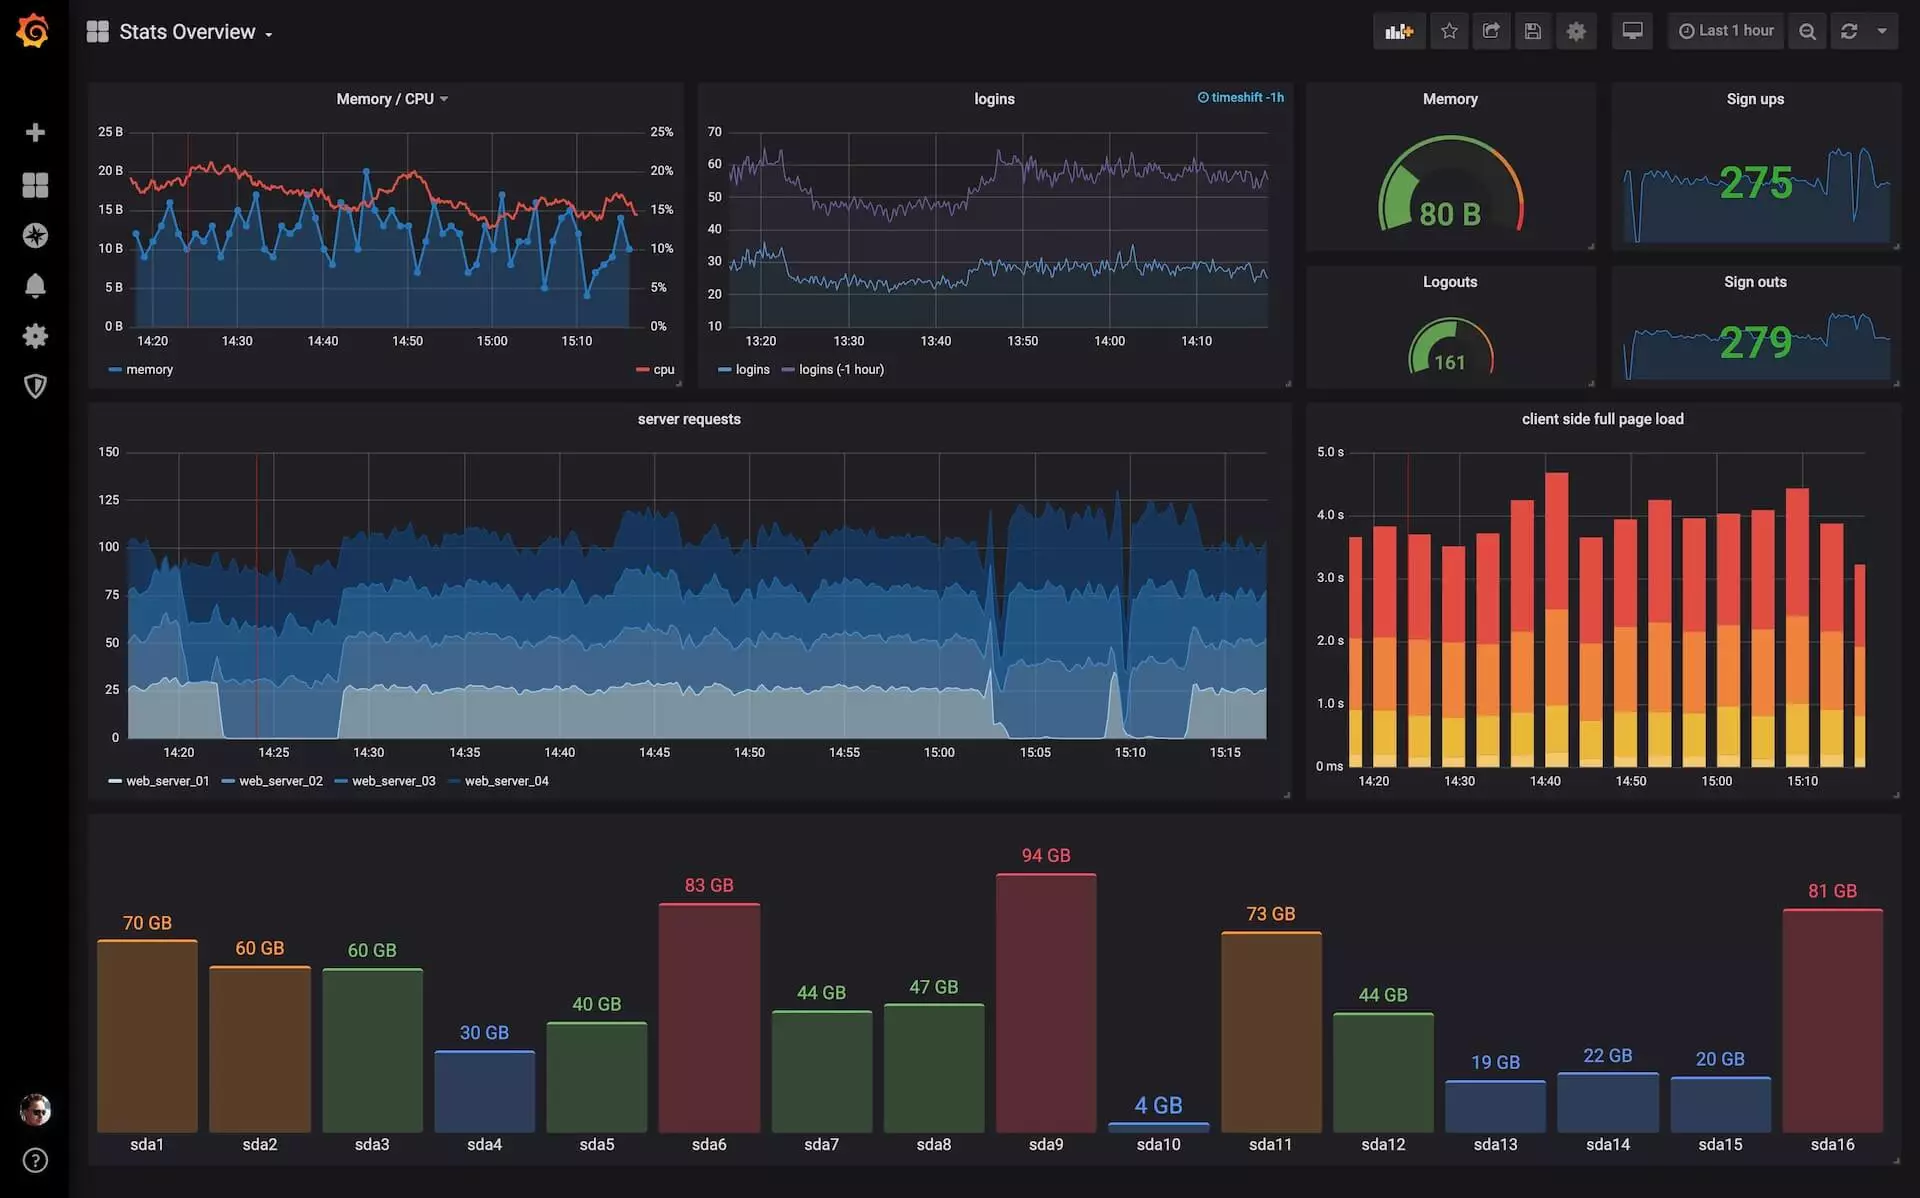
Grafana: Grafana is a visualization tool that can be used to display metrics collected by Prometheus. This tool can be used to create visual monitoring dashboards along with various charts. Also, the ability to create an alert is another feature of this tool.
Datadog: The Datadog platform is a non-free cloud monitoring and analysis platform that supports the services of cloud service providers such as AWS, Azure, Google Cloud, etc. This platform provides high-quality real-time monitoring, alerting and analytics and can be used to monitor the performance and health of distributed systems.
New Relic: The New Relic platform is a cloud-based monitoring and analytics platform similar to Datadog that provides real-time monitoring, alerting and analytics. This platform supports multiple programming languages and can be used to monitor the performance of distributed systems.
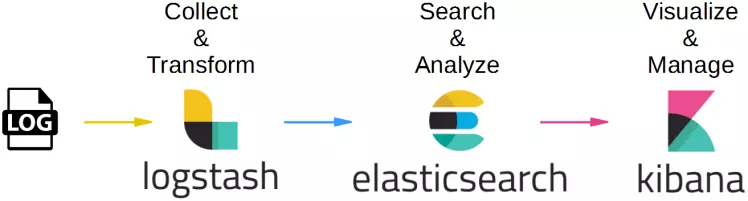
Elastic Stack: The Elastic Stack platform is an open source toolkit that provides several tools for monitoring, reporting and analysis. These tools include Elasticsearch, Logstash, and Kibana, which can be used together to collect, store, and analyze logs and metrics.
Zabbix: Zabbix is an open source infrastructure monitoring tool capable of monitoring servers, applications, networks and services. This tool provides alerting, visualization and real-time reporting of resources with a flexible and scalable architecture. Zabbix tool is user friendly and widely used in small and large organizations.
Monitoring and analysis are essential components of a scalable distributed system. They provide information about system performance, availability, and health, and help identify issues before they affect end users. Implementing a monitoring system requires defining relevant metrics and alert thresholds, selecting appropriate monitoring tools, collecting and analyzing logs, and automate remediation. By implementing a proper monitoring system, system administrators can ensure that their scalable and distributed systems are always available, efficient, and error-free.

I am Reza Babakhani, a software developer. Here I write my experiences, opinions and suggestions about technology. I hope that what I write is useful for you.


leave a comment